

Annual Report 2023
A Path Forward
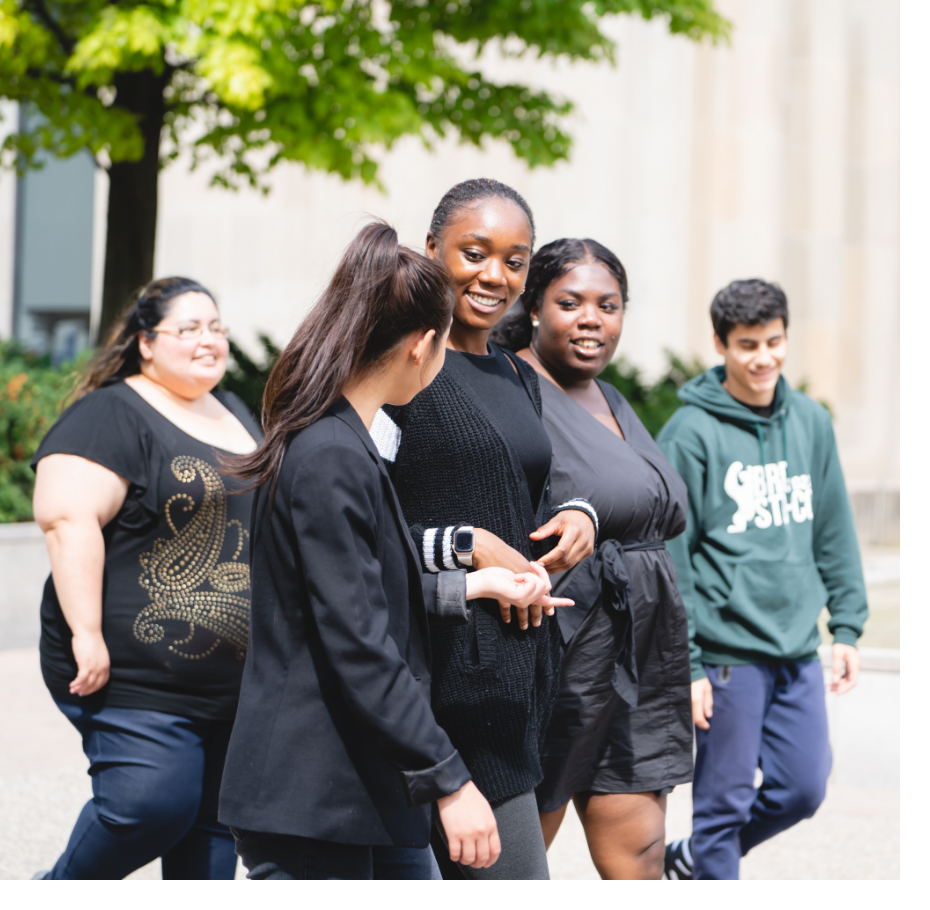
Fueling the Graduation Effect
For students living in low-income communities, high school graduation opens so many doors.


Measuring our Impact
31
Pathways Program locations across Canada
6,879
students enrolled in the Pathways Program
21,000+
students across Canada have received support from the Pathways Program since 2001
78%
is the average graduation rate in Pathways communities across the country
64%
of Pathways graduates transitioned to post-secondary education or training
900+
people volunteered their time with Pathways
32,000+
volunteer hours were donated
More Students. More Communities. More Impact.
An interactive look at how we’ve grown over the past two decades.
Drag the timeline to see how we’ve grown over the past two decades.


Regent Park
(Founding partner)

Regent Park
(Founding partner)
Verdun
Ottawa
Lawrence Heights
Rexdale
Kitchener
Regent Park
(Founding partner)
Verdun
Ottawa
Lawrence Heights
Rexdale
Kitchener
Scarborough Village
Hamilton
Regent Park
(Founding partner)
Verdun
Ottawa
Lawrence Heights
Kitchener
Hamilton
Kingston
Halifax
Winnipeg
Regent Park
(Founding partner)
Kingston
Verdun
Ottawa
Lawrence Heights
Kitchener
Hamilton
Halifax
Winnipeg
Shawinigan
Regent Park
(Founding partner)
Kingston
Verdun
Ottawa
Lawrence Heights
Kitchener
Hamilton
Halifax
Winnipeg
Shawinigan
Sherbrooke
Pointe-Saint-Charles
Mashteuiatsh
Regent Park
(Founding partner)
Kingston
Verdun
Ottawa
Lawrence Heights
Kitchener
Hamilton
Halifax
Winnipeg
Shawinigan
Sherbrooke
Mashteuiatsh
Lachine
Vancouver
Regent Park
(Founding partner)
Kingston
Verdun
Ottawa
Lawrence Heights
Kitchener
Hamilton
Halifax
Winnipeg
Shawinigan
Sherbrooke
Mashteuiatsh
Vancouver
Saint John
Regent Park
(Founding partner)
Kingston
Verdun
Ottawa
Lawrence Heights
Kitchener
Hamilton
Halifax
Winnipeg
Shawinigan
Sherbrooke
Mashteuiatsh
Vancouver
Saint John
Surrey
Saskatoon
Regent Park
(Founding partner)
Kingston
Verdun
Ottawa
Lawrence Heights
Kitchener
Hamilton
Halifax
Winnipeg
Shawinigan
Sherbrooke
Mashteuiatsh
Vancouver
Saint John
Surrey
Saskatoon
Saint-Roch
Longueuil
Joliette
Gatineau
Laval
Edmonton
Regent Park
(Founding partner)
Kingston
Verdun
Ottawa
Lawrence Heights
Kitchener
Hamilton
Halifax
Winnipeg
Shawinigan
Sherbrooke
Mashteuiatsh
Vancouver
Saint John
Surrey
Saskatoon
Saint-Roch
Longueuil
Joliette
Gatineau
Laval
Edmonton
Drummondville
Sept-Îles
Matane
Matapédia
Thunder Bay
Regent Park
(Founding Partner)
Verdun
Ottawa
Lawrence Heights
Rexdale
Kitchener
Scarborough Village
Hamilton
Kingston
Halifax
Winnipeg
Shawinigan
Sherbrooke
Pointe-Saint-Charles
Mashteuiatsh
Lachine
Vancouver
Saint John
Surrey
Saskatoon
Saint-Roch
Longueuil
Joliette
Gatineau
Laval
Edmonton
Drummondville
Sept-Îles
Matane
Matapédia
Thunder Bay
Drag the slider to move through the years

Community Highlights
A look at how Pathways Program locations across the country are delivering programming to set youth up for future success.

National Highlights
A look at how Pathways Canada is scaling for impact at a national level to support the next generation of students.
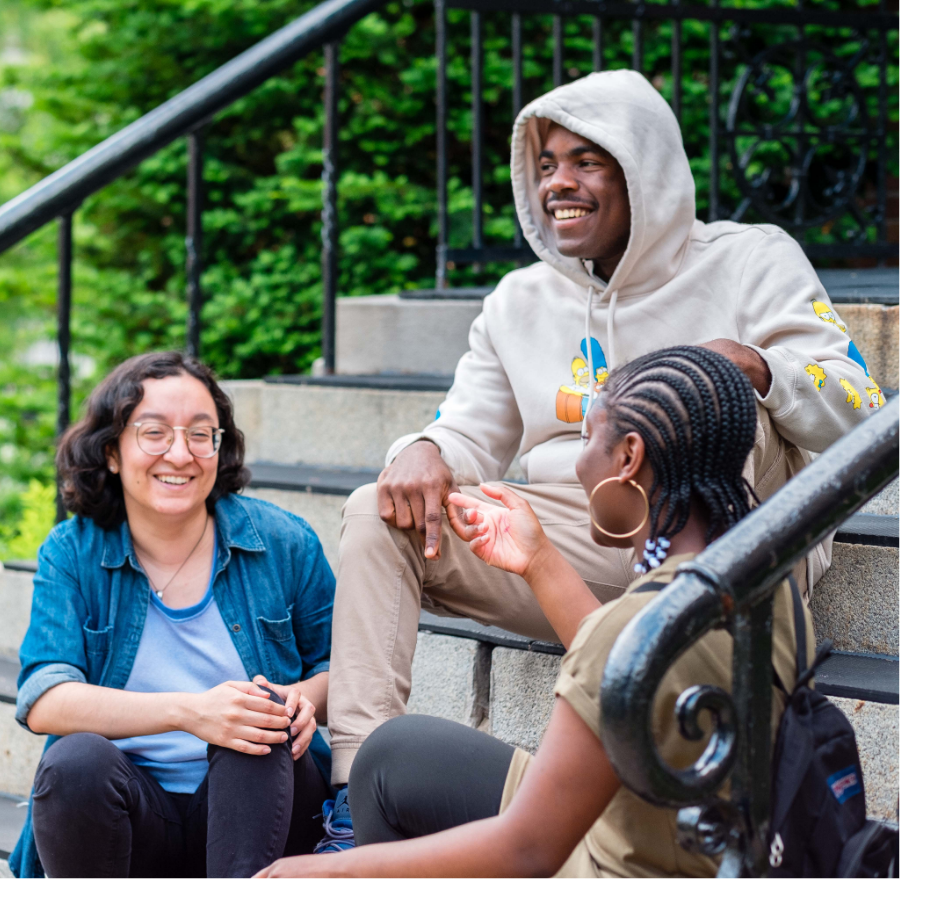
Pathways Voices
Stories of impact from across the Pathways network

Neha, Pathways alum

There’s so much value in listening to young people and their experiences. More and more organizations are realizing it, and I’m excited to do my part in encouraging that shift.


Abdul, Pathways staff
How do we use technology more effectively? The more I focus on that, the more time staff have to focus on scaling the organization and increasing our impact.

Mars, Pathways alum
I learned a lot about my own culture at Pathways. The program incorporated Indigenous culture, like the Seven Teachings: love, respect, courage, honesty, wisdom, humility, and truth.

Tyler, Pathways staff
That’s what makes it possible for us to do good work with young people. If you have the relationships, the rest falls into place.
Thank you to our supporters
Our national impact is made possible thanks to the generous support of public and private funders across the country.
Financials
Revenue
- 61% - Government
- 10% - Corporations
- 23% - Foundations and agencies
- 6% - Individuals
Expenses
- 56% - Pathways to Education Program™ delivery
- 5% - Student scholarships and post-secondary support
- 19% - Program growth, expansion, and innovation
- 4% - Program development, research, and evaluation
- 11% - Fundraising and awareness
- 5% - Operations and administration